Update: Gantt Charts In FileMaker

Nearly 3 years ago, Kevin McGee wrote a blog post entitled How to: Gantt Charts in FileMaker. Since then, we’ve had a lot of interest in native Filemaker Gantt charts. Today I would like to show you a sample file with a very simple Gantt chart, and explain some of the basic principles involved.
Download the sample file:
FP7 (Filemaker 11)
FMP12 (Filemaker 12) (Download the unlocked version of the Gantt Chart Solution at the bottom of the page)
Here is what the chart looks like in FileMaker 11:
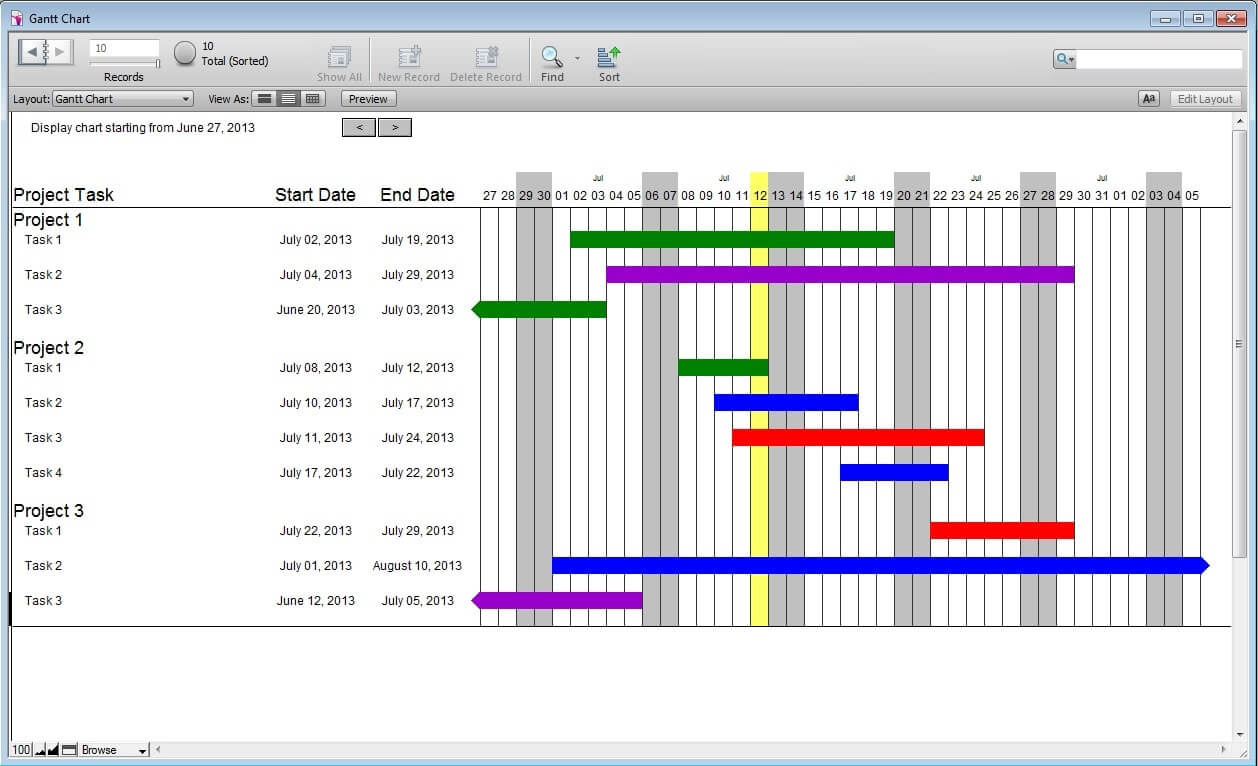
This example uses no container fields and no external code. The entire chart is displayed using conditional formatting on top of repeating fields.
The chart’s date range is driven by a single global date field. This field (called zv__startDate__gd) seen in a merge field at the top left, determines the starting date of the chart. There is then a repeating global date field (zc__date__rgd) used to get each day in the chart based on that starting date. In this example, I have set the number of repetitions to 40, however this can be changed to any number.
Extend(zv__startDate__gd) + Get(CalculationRepetitionNumber) – 1The dates displayed at the top of the chart are based on this field. A second repeating field in the Task table is used to determine if the current date of the chart falls within the start and end dates of the Task
Let([current_date = Extend(zv__startDate__gd) + Get ( CalculationRepetitionNumber )];If(current_date > Extend(startDate) and current_date < Extend(endDate) + 2; Extend(colour)))This field sets the value of each repetition that falls within the date range to the value of the colour field. This simply prints the colour as text inside the repeating field, however once we apply some conditional formatting we can change that to fill the entire cell with the correct colour.
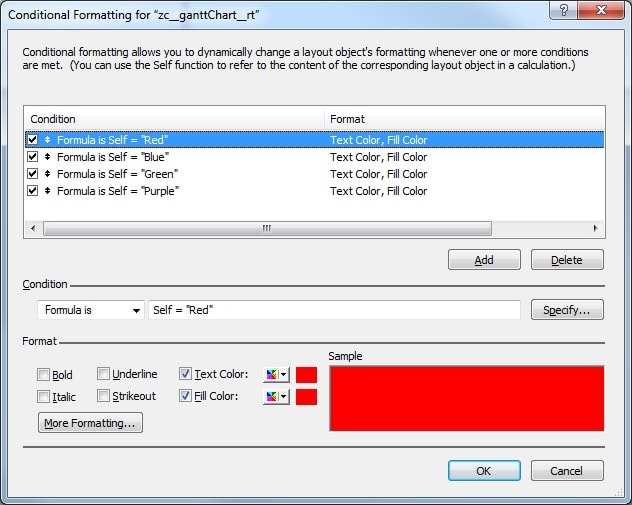
Lastly, to make the chart look a little cleaner we will need an empty repeating field to sit behind everything else and provide the styling for the background of the report. In this example, we have borders to display vertical lines down the layout denoting each day, we also have conditional formatting to make the weekends grey and the current day yellow.
GetRepetition (Task::zc__date__rgd ;Get ( CalculationRepetitionNumber )) = Get ( CurrentDate )Let([day_name = DayName(GetRepetition ( Task::zc__date__rgd ;Get ( CalculationRepetitionNumber )))];day_name = “Sunday”orday_name = “Saturday”)These are the basic principals used in this simple Gantt chart example. If you are looking to make your own Gantt chart, I hope that you will find at least some of this article helpful. If you have any questions or comments feel free to leave them in the section below.
Update: Thank you to everyone who has contacted me about this article. If you’re interested in getting more information or an unlocked copy of the sample files please contact me by email or leave a comment below.
Update 2: I've gotten so much positive feedback from this article, thank you to everyone who has contacted me or posted a comment. Please note that we try to get in touch with everyone who makes a comment on this article privately by email as soon as we can.
Update 3: Wow, over 100 Comments! Thanks to everyone who has continued to comment and share this article. We have created a new page that will make downloading the FileMaker solution easier. Please visit our new page if you would like to download an unlocked version of the Gantt Chart Solution.


Comments